Many research questions are intended to addressed by
different scores, such as:
- Can patients provide self-psychological evaluations that agree with psychology professionals’ ratings?
- How well do the attributes of teachers fit the needs or desires of the students?
- Are values of the supervisors of an organization match the values of the subordinates?
- What are the degrees of similarity between perceived stigma of mental ill patients and their caregivers?
We can start answering the questions by looking at the fit,
similarity or agreement between two constructs as a predicting factor (Edwards,
1994). However, different scores can be problematic if we do not handle them in
a right way. For instance, different scores are less reliable than either of
their component measures. Moreover, people often reduce three-dimensional
relationships between two component measures and the outcome measure to two
dimensions.
In order to measure the congruence between two constructs
and how that affects the outcome, Jeff
Edwards (2002) proposed polynomial regression and three-dimensional
response surface methodology as a solution for the problem. Polynomial regression
approach consists the difference and the higher order terms such as the
quadratic terms and the interaction of two measures. The polynomial regression analysis
also allows researchers to conceptualize the joint effects of the two
constructs on an outcome as a three-dimensional surface.
Let us walk you through how to construct polynomial
regression. There are a few steps we can follow:
- Fit in a linear model by using two construct measures (X & Y) as predictors and Z is the outcome. Calculate R Square and if R Square is not significant, we stop the procedure.
Z=b0+b1X+b2Y+e
- If the R square is significant, then we added quadratic terms X2 &Y2 and interaction terms XY as set into the model. We test the increment in R Square and if the increment in R Square is not significant, we return back to the linear model.
Z=b0+b1X+b2Y+
b3X2+ b4 XY+b5Y2+e
- If the increment in R Square is significant, we added cubic terms X3, X2Y, XY2 andY3. Again, we test the increment in R Square and if the increment in R Square is not significant, we return back to the quadratic model.
Z=b0+b1X+b2Y+
b3X2+ b4 XY+b5Y2
b6X3, b7X2Y, b8XY2 +
b9Y3+e
After we established our model, now it is time to draw some
fancy 3D response surface graphs. Jeff Edwards made the process very easy. You
can download the Excel
file for plotting response surfaces and plug in the coefficients of your
model. The excel file will generate the graph automatically for you.
Here are some samples of the response surfaces graphs:
Linear:
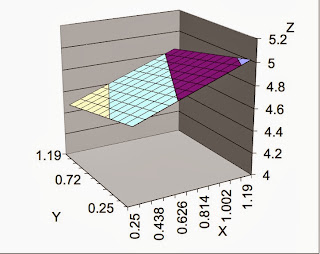
Quadratic:

Reference:
Edwards, J. R.
(1994). The study of congruence
in organizational behavior research: Critique and a proposed alternative. Organizational
Behavior and Human Decision Processes, 58, 51-100 (erratum, 58, 323-325).
Edwards, J. R.
(2002). Alternatives to difference
scores: Polynomial regression analysis and response surface methodology. In F.
Drasgow & N. W. Schmitt (Eds.), Advances
in measurement and data analysis (pp. 350-400). San Francisco: Jossey-Bass.
No comments:
Post a Comment